[Definition of Business: …the practice of making one’s living by engaging in commerce…]
[Definition of Intelligence: …the ability to acquire and apply knowledge and skills…]
Without both – you will have neither!
I’m an avid reader of pretty much all things “Technical” – especially since it relates to FinTech.
Lately, I’ve seen a slew of articles about so-called “cognitive” and “predictive” systems – how Blockchain technology and the Internet of Things (IoT) will change life as we know it. Lastly – but by no means least – how cyber security (or lack thereof) is becoming increasingly important.
How then can people employed on the technical side of things ensure that their non-technical – but business focused bosses – make smart and informed decisions about what to do next?
Non-technical bosses typically don’t “speak Geek” – whereas, the technicians themselves are often incapable of explaining things in a fashion which doesn’t make the non-Geeks’ eyes glaze over!
In an attempt to bridge the Geek versus, the rest divide – I once spent a lot of time working on a set of tools from Microsoft known as; Visual Studio “LightSwitch.” The product was discontinued in October 2016 but will continue to be supported (as a component of Visual Studio 2015, until some time in the year 2020) and I personally no longer use it. Nevertheless, I’ll never forget just how quickly I was able to use the tools and quite literally deliver a new app in virtually no time.
Once I’d linked to one or more databases, I was able to quickly “translate” the various Table and individual Field names appearing on the LightSwitch front-end to whatever the User wanted – just like that. Furthermore, any subsequent Queries/Reports, etc., would reflect the User-preferred terms and not those typically applied by Database Administrators – (e.g. “Client Clearing Code” instead of “CltClrgSysId”.)
It was great while it lasted. So what’s available now?
Well, things change, and lately, I’ve been looking into how Mainframes have evolved over the years – in particular, IBM’s z Systems and their Linux variants.
In previous posts, I’ve reported on just how powerful and secure they are, and in many ways, so vastly superior to x86 type technology. Indeed, this is exactly why so many of the world’s top banks, credit card companies, airlines, etc., still use Mainframe technology. See the following excerpts from my previous blogs to get a feel for what I’m talking about:
[easy-tweet tweet=”For IT infrastructures that run their private cloud, z Systems can run up to 8,000 virtual servers” hashtags=”IT, z Systems”]
When compared to an x86/ distributed server environment, the operational costs of the z Systems are half, while the performance is 30 percent greater.
For IT infrastructures that run their private cloud, or wish to, z Systems can run up to 8,000 virtual servers, while saving money.
It lowers costs because there are fewer software licenses to bother with, lower energy consumption, and the cabinet of a z System takes far less room, lowering the need for facilities and facility upkeep.
As if the standard “raw power” proffered by a z System wasn’t enough – there are Partners who specialise in optimising the throughput of various applications and routines. An example is that one such firm enabled a major US Bank to reduce the time taken to process some particularly complex batch jobs from over ten hours to less than one minute!
More recently, I’ve been looking at some Press Releases regarding DataKinetics and their relationship with the Danish company called SMT Data – and in particular – taking a look at their “LightSwitchEsque” front-end tools.
The tools and services are being promoted under the banner “IT Business Intelligence” – (often times shortened to ‘ITBI’) – and the sample screenshots and testimonials are very impressive indeed.
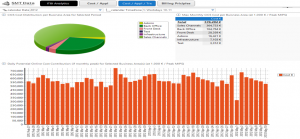
For example – take a look at the following excerpt and screenshot:
Business mapping and cost mapping makes the stored information understandable in all areas and on all levels of the organisation, while reports specifically created for and directed to very different recipients all share the same data source (resulting in ‘one truth’).
Optimisation needs no longer to be suggested, planned, prioritised and executed by technical staff only.
As an example, the following picture shows a report on the potential daily CPU costs (if it turns out to be the monthly peak, which in this case is the cost driver) with totals divided into applications/business areas. Through the BI functionality, a mouse click on a specific day will change all values in the report to cover this day only. Likewise, a mouse click on a specific business area will change all values in the report to show cover this business area only:
With the right tools, organisation and processes, and with a relatively small amount of time and effort, optimisation can save a large IT organisation millions in costs a year.
Think about that – Geeks producing reports and analyses that the Business folk can truly understand – and then make better, smarter, informed, more businesslike and intelligent decisions.
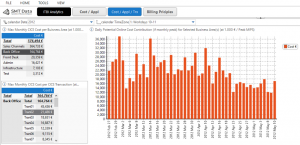
Take a look at another excerpt and screenshot:
Enriching the technical data with information about who is using the capacity can be helpful in the dialogue with developers or business users. Also, adding cost information makes it easier to prioritise optimisation efforts, quantify trade-offs, and document the resulting savings.
Imagine how much more “bang for the buck” you could realise for your business by getting a true handle on just where the money is being spent – then having the expertise of an ISV like DataKinetics to delve under the hood and truly optimise the workloads – further driving value out of the true workhorse in your infrastructure.
All pretty impressive stuff! Finally, it seems that there’s a way to get all members off a company’s team to begin speaking the same language…
…and bring a lot more intelligence into their Business.
Kevin J. Davis, Researcher & Analyst, Compare the Cloud
Kevin has worked continuously in the Financial Services Industry (primarily on the IT side) for over thirty years.
During this time he has worked first-hand on major Industry Initiatives both in the U.K. and the USA – such as TALISMAN, TAURUS, CREST, (the Bank of England’s) CGO, Counterparty/Client/Settlement Risk Reporting, CHAPS, Model A and B type Clearing, Intra-Day Payment Netting, Capital Gains Tax Reporting, Regulatory Reporting, Trading Interfaces (from DOT through to FIX API’s and beyond), Multi-Instrument and Multi-Currency systems, Direct Market Access and Custodian Services.
As a result, Kevin boasts a wealth of experience and knowledge regarding the latest FinTech innovations.


Comments are closed.